V3+-bearing,
Mg-rich,
strongly disordered olenite from a graphite deposit near Amstall, Lower
Austria: A structural, chemical and spectroscopic investigation
Andreas Ertl
Institut für Mineralogie und
Kristallographie,
Geozentrum, Universität Wien
Althanstrasse 14, 1090 Vienna, Austria
George R. Rossman
Division of Geological and Planetary Science
California Institute of Technology, Pasadena, CA 91125-2500, USA
John M. Hughes
University
of Vermont, 348B Waterman Building, Burlington, Vermont 05405, U.S.A.
Chi Ma
Division of Geological and Planetary Science
California Institute of Technology, Pasadena, CA 91125-2500, USA
Franz
Brandstätter
Mineralogisch-Petrographische Abteilung,
Naturhistorisches Museum, Burgring 7, 1010 Vienna, Austria
Abstract
An optical
absorption
spectrum, structural and chemical
data of green V- and Cr-bearing tourmaline from the
graphite deposit at
Weinberg Mountain, west of the village of Amstall, Lower
Austria, were
obtained. To address the role of V and Cr in the
spectrum of tourmaline, examination of additional samples of V- and
Cr-containing tourmalines was conducted. This study confirmed that V
and Cr
produce similar spectra in tourmalines.
However, the
wavelengths of
the 600 nm region band (E\\c), and the 440 nm region band (E^c) varied in relation to the
proportion of Cr in the
sample. Likewise,
the intensity of the
680 nm region spin-forbidden bands varies in proportion to the absolute
amount
of Cr in the sample. Molar absorption coefficients for both V and Cr in
tourmaline were determined for the 600 nm region. For
the E^c band, ε(V) = 12.3
± 0.7;
ε(Cr) = 39.7 ± 1.4; and for the E\\c band,
ε(V) = 11.9 ± 2.0; ε(Cr) =15.9
±
2.8. In each case the Cr bands are more intense than the corresponding
V band.
These features can be used to
confirm that the
spectroscopic features of the Amstall tourmaline come dominantly from
V. The
optimized formula, calculated using structural and chemical data for
the core
of a 4 mm wide crystal, is X(Na0.69Ca0.16K0.010.14)
Y(Al1.46Mg1.34V3+0.11Ti4+0.05Cr3+0.02Fe0.02)
Z(Al4.77Mg1.23)
(BO3)3 T(Si5.70Al0.30)
O18 [(OH)3.87O0.13],
with a = 15.984(2), c
=
7.222(2) Å, R = 0.017.
The optimized
formula, calculated using structural and chemical data for the rim, is X(Na0.67Ca0.24K0.010.08)
Y(Al1.57Mg1.24V3+0.11Ti4+0.05Cr3+0.02Fe0.01)
Z(Al4.84Mg1.16)
(BO3)3 T(Si5.90Al0.10)
O18 [(OH)3.35O0.65],
with a = 15.9175(5), c
=
7.1914(4) Å, R = 0.014.
Whereas the V3+
and Cr3+ contents stay constant, Mg decreases
from the core to the
rim. This is reflected by decreasing <Y-O>
(from 2.013 to 2.003 Å) and <Z-O>
distances (from 1.938 to 1.930 Å). The relative short <Y-O> distances and the enlarged
<Z-O> distances show
that Al and Mg are strongly disordered
between the Y and Z
sites in this tourmaline. We
assume that the strong Mg-Al
disorder between the Y and the Z sites in this tourmaline derived from
a high-T
overprint (~750°C,
~6-9 kbar) during crystallization, which is supported by a relatively
high
amount of [4]Al and low vacancies at the X site.

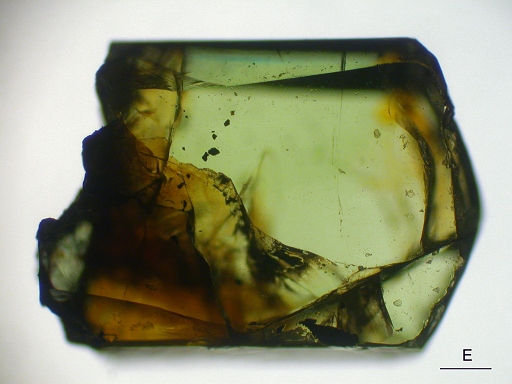
Polished 1.7 mm long slab of
vanadian olenite from Amstall,
viewed in linerally polarized light, E\\c
Hand specimen of
olenite in graphite.
Two
olenite crystals from Amstall in matrix approximately 1.5 mm long.
Composition and Spectra of other V- and Cr-containing tourmalines:
1)
GRR2128,
Mogok area, Myanmar, a vanadium dominant uvite
, plotted
for 1.0 mm thickness.
Electron microprobe anlaysis GRR2128
| Cr2O3 |
|
0.049 |
| V2O3 |
|
0.614 |
| "FeO" |
|
0.011 |
| V/Cr ratio |
|
12.6 |
2) GRR2396, a uvite from Kenya
Electron microprobe anlaysis
| Cr2O3 |
|
0.098 |
| V2O3 |
|
0.294 |
| "FeO" |
|
0.064 |
| V/Cr ratio |
|
3.0 |
3)
GRR1719,
A dravite with more V than Cr, plotted for 1.0 mm thick.
Electron microprobe anlaysis
| Cr2O3 |
|
0.199 |
| V2O3 |
|
0.452 |
| "FeO" |
|
0.002 |
| V/Cr ratio |
|
2.3 |
4)
GRR 768,
a uvite with somewhat more V than Cr, plotted as 1.0 mm thick.
Electron microprobe anlaysis
| Cr2O3 |
|
0.141 |
| V2O3 |
|
0.244 |
| "FeO" |
|
0.004 |
| V/Cr ratio |
|
1.7 |
5)
GRR 2467,
a uvite from Tanzania with more Cr than V, plotted as 1.0 mm thick.
Electron microprobe anlaysis
| Cr2O3 |
|
0.140 |
| V2O3 |
|
0.045 |
| "FeO" |
|
0.033 |
| V/Cr ratio |
|
0.3 |
