Jed L. Mosenfelder, Marion Le Voyer, George R.
Rossman
Yunbin Guan, Paul D. Asimow,
John Eiler
Division of Geological and Planetary SciencesCalifornia Institute of Technology, Pasadena, CA 91125-2500, USA
David R. Bell
School of Earth and Space ExplorationArizona State University, Tempe, AZ 85287, USA
American Mineralogist 96, 1725-1741
ABSTRACT
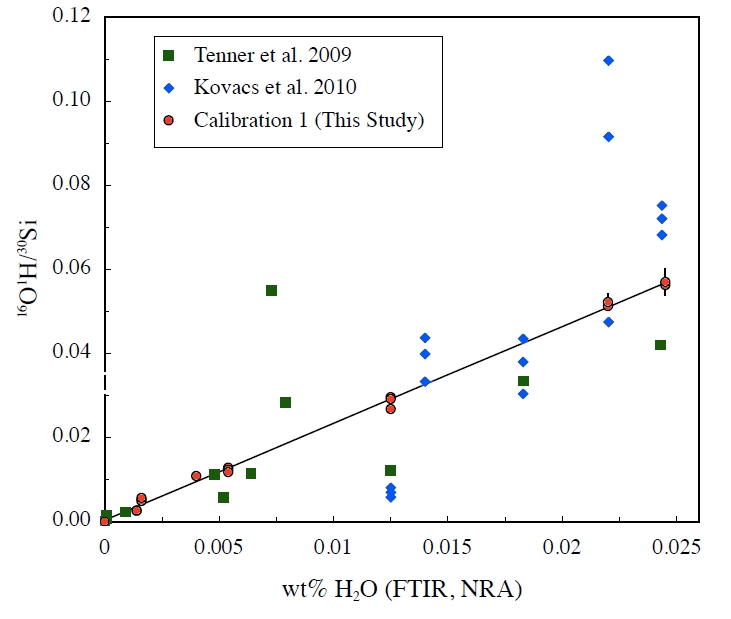
We measured hydrogen concentrations in 12 olivines using secondary ion
mass spectrometry (SIMS and NanoSIMS), cross-calibrated against Fourier
transform infrared (FTIR) spectroscopy and nuclear reaction
analysis (NRA). Five of these samples are routinely used for
calibration in other laboratories. We
assess the suitability of these olivines as standards
based on over 300 SIMS analyses, comprising 22 separate calibrations.
Seven olivines with 0-125 ppm H2O
give highly reproducible results; in contrast to previous
studies, the data are fit to well-constrained calibration lines with
high correlation coefficients (r2 =
0.98-1). However, four kimberlitic megacrysts with 140-245
ppm H2O sometimes yield 16O1H/30Si
ratios that have very high uncertainties and can vary by up
to a factor of two even in sequential analyses. An obvious
cause of such behavior is the presence of sub-microscopic inclusions of
hydrous minerals, such as serpentine. In most cases,
however, we link the anomalies to the presence of sub-micron to
micron-scale pores (as small as 100 nm), imaged using SEM
and NanoSIMS. These pores are interpreted to be fluid
inclusions containing liquid H2O, other
volatiles (including fluorine) and/or condensed hydrous
phase precipitates. Ionization of the pores contributes
variably to the measured 16O1H,
resulting in analyses with erratic depth profiles and
corresponding high uncertainties (up to 16%, 2σmean).
After filtering of these analyses using a simple criterion based
on the error predicted by Poisson counting statistics, all the
data fit well together. In contrast to previous studies, our results
imply that the Bell et al. (2003) calibration can be applied
accurately to all olivines with IR bands from ~3400-3700 cm-1,
without the need for band-specific IR absorption coefficients.

Raw Data: Olivine samples:
IR Spectra (Microsoft Excel files with alpha, beta and gamma spectra):
All spectra in one fileGRR 1012-2
GRR 1629-2
GRR 1695-2
GRR 1784e
GRR 997
GRR 999a
KLV 23
ROM 177
ROM 250 ol 13
ROM 250 ol 2
Appendices: Electron microprobe and SIMS analyses and calibration data (Microsoft Excel files):
Appendix 1: Electron microprobe analyses of olivine standardsAppendix 2: SIMS analyses, May 2009
Appendix 3: SIMS analyses of olivine, March 2010
Appendix 4: SIMS analyses, Calibration 19, March 2010
Appendix 5: NanoSIMS analyses, Calibrations 20-22
Last update: 14-Oct-2014