Juanitaite, a new mineral from Gold Hill, Utah
Anthony R. Kampf
Mineral Sciences Section, Los Angeles County Museum of Natural History
900 Exposition Boulevard, Los Angeles, California 90007
William. S. Wise
Department of Geological Sciences, University of California
Santa Barbara, California, USA 93106
George R. Rossman
Division of Geological and Planetary Sciences, California Institute
of Technology
Pasadena, California, USA 91125
Published in Mineralogical Record, 31, 301-305
 |
|
Juanitaite from the Gold Hill mine, Gold Hill, Tooele
County, Utah, USA
Los Angeles County Museum of Natural History specimen
number 47573
|
Abstract
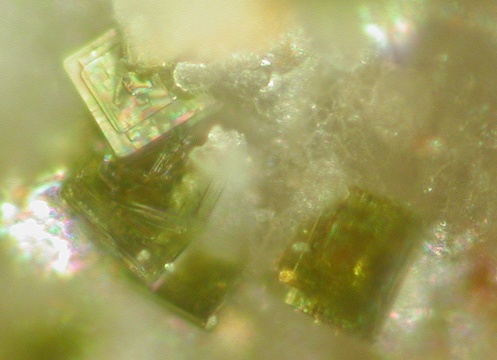
Juanitaite is olive green to grass green with a pale greenish-yellow
steak and resinous to dull luster. It is translucent and non-fluorescent.
Crystals are tabular on {001} and also exhibit the forms: {110} and {310}.
Twinning was not observed. Plates are flexible, but not elastic. Cleavage
is perfect on {001} and {110} and good on {100}. Fracture was not observed.
The specific gravity measured by sink-float in Clerici solution is 3.61(5)
g/cm3. The calculated density is 3.56 g/cm3. Crystals
are uniaxial (-), w 1.785(5), e
1.705(5) (white light), but subparallel aggregates yield an anomalous biaxial
figure (2V @ 20°). No dispersion was observed. Pleochroism: O = olive
brown, E = olive green.
Juanitaite is tetragonal, space group P42/nnm, a = 9.961(3), c = 29.19(2)
Å, V = 2896(2) Å3, Z = 4. Electron microprobe analyses
provided: CaO 8.64, FeO 2.32, CuO 35.97, Bi2O3 14.82,
As2O5 29.35, H2O 8.90 (by difference),
total 100.00 wt%. H2O was confirmed by infrared spectroscopy.
Juanitaite has a close chemical relationship with mixite, Cu6Bi(AsO4)3(OH)6·3H2O.
The six strongest powder diffraction lines are [d(Å)(I)(hkl)] 14.6(100)(002),
7.04(50)(110), 6.34(70)(112), 5.07(50)(114), 3.146(60)(310,303), 2.535(50)(228).
Additional Pictures of Juanitaite
Figure 1. Olive-green crystals of juanitaite covering matrix.
Figure 2. Crystals are typically 0.05 mm wide.
Figure 3. The crystals often are stacks of thin plates.
Figure 4. Interpenetrating crystals show the stack of thin plates.
Figure 5. Spiral growth patterns are common on individual crystals.
Figure 6. Scanning electron microscope
image clearly showing the stack of plates and the spiral growth pattern.
Infrared Spectrum
The strong absorption in the 3500 cm-1 region of the infrared spectrum demonstrates that there is water in the mineral. The raw infrared data are available as a text file (wavenumber, %T).