GEORGE R. ROSSMAN and M.N. TARAN
Division of Geological and Planetary Sciences
California Institute of Technology
Pasadena, CA 91125, USA
American Mineralogist 86, 896-903
ABSTRACT
Optical spectra are presented for seven oxygen-based, four-coordinated Fe2+ bearing minerals, eudialyte, gehlenite, genthelvite, gillespite, pellyite, spinel, and staurolite, and two five-coordinated Fe2+ minerals, grandidierite and joaquinite. Broad, intense spin-allowed dd bands of tetrahedrally coordinated Fe2+, originating from the 5E -> 5T2g transition, appear in the spectral range 3,000 to 7,000 cm-1. In the spectra of gillespite and eudialyte, minerals with square-planar coordination, the bands shift to higher energies, appearing in the range 7,000-20,000 cm-1. The amount of band splitting depends mainly on the distortion of the ligands surrounding four-coordinated Fe2+. It is minimal for spinel with a regular tetrahedral site, and maximal for eudialyte and gillespite. For the minerals in four-coordination the barycenter of the split bands is well-correlated with the sum of the bond-length and edge-length distortion parameters if the square planer sites are excluded from the correlation. Molar absorption coefficients (e) of the spin-allowed tetrahedral Fe2+ bands range from ~20 cm-1×liter×mol-1 to ~90 cm-1×liter×mole-1. For eudialyte and gillespite, due to the centrosymmetric character of the ligand environment, the e values ranges from about 0.5 to 10 cm-1×liter×mole-1. For grandidierite and joaquinite, five-coordination causes spectra that resemble those of Fe2+ in highly distorted octahedral sites. The number of bands suggests, however, that the electronic level scheme of five-coordinated Fe2+ in grandidierite significantly differs from those of Fe2+ in octahedral coordination.
Data files from the paper
| Mineral | Idealized Formulas | Spectrum | Data Files |
| eudialyte | Na15Ca6Fe3Zr3Si25O73(OH)5 | Eudialyte.gif | 0.039 mm eudialyte160.a
0.039 mm eudialyte160.c |
| gehlenite | Ca2(Al,Fe)2SiO7 | Gehlenite8013.gif | 0.164 mm gehlenite8013.a
0.164 mm genlenite8013.c |
| genthelvite* | (Zn,Fe)4Be3(SiO4)3S | Genthelvite9305.gif | 0.041 mm genthelvite9305 |
| gillespite | BaFeSi4O10 | Gillespite1787.gif | 0.100 mm gillespite1787.a
0.100 mm gillespite1787.c |
| pellyite | Ba2Ca(Fe,Mg)2Si6O17 | 0.030 mm Pellyite334.gif | 0.032 mm pellyite334.a
0.028 mm pellyite334.b 0.028 mm pellyite334.c |
| spinel | (Mg,Fe)Al2O4 | Spinel153.gif | 0.434 mm spinel56163-151
0.848 mm spinel56163-152 0.410 mm spinel56163-153 0.330 mm spinel62047-6 0.966 mm spinel62047-7 |
| staurolite | (Fe,Mg)2Al9Si4O22(OH)2 | Staurolite47.gif | 0.062 mm staurolite47.alpha
0.064 mm staurolite47.beta 0.062 mm staurolite47.gamma |
| grandidierite | (Mg,Fe)Al3(BO4)(SiO4)O | 0.60 mm Grandidierite441.gif Errata: the labels for the beta and gamma spectra were reversed in Fig. 9 in the American Mineralogist paper. The spectra in the link above are correct. |
0.579 mm grandidierite441.alpha
0.579 mm grandidierite441.beta 0.760 mm grandidierite441.gamma |
| joaquinite | Ba2NaCe2FeTi2Si8O26(OH)•H2O | 0.050 mm Joaquinite158.gif | 0.050 mm joaquinite158.alpha
0.050 mm joaquinite158.beta 0.050 mm joaquinite158.gamma |
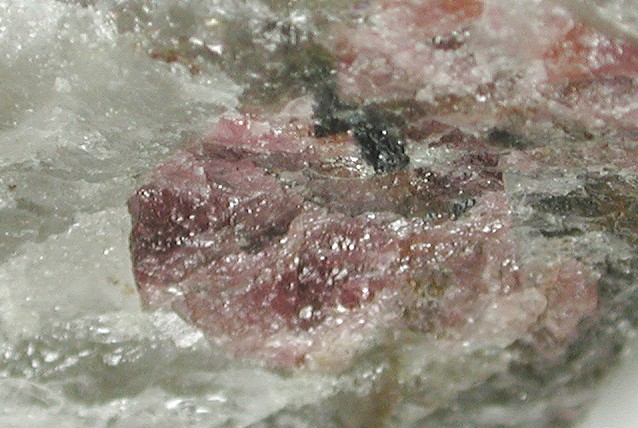
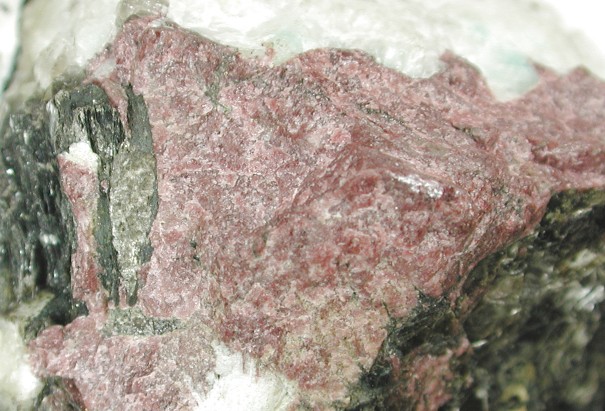
* Genthelvite, Zn4Be3(SiO4)3S, forms a solid-solution series with danalite, Fe4Be3(SiO4)3S, a red mineral.
Individual color figures from the paper in TIF format (~170 K each).
Figure 1 Figure 2 Figure 3 Figure 4 Figure 5 Figure 6 Figure 7 Figure 8 corrected-Figure 9 Figure 10 Figure 11 Figure 12