 |
 |
Optical spectroscopy
study of tuhualite
and
a re-examination of the beryl, cordierite
and osumilite spectra
M.N. Taran and George R. Rossman
Division of Geological and Planetary Sciences
California Institute of Technology
Pasadena, CA 91125 USA
American Mineralogist
|
|
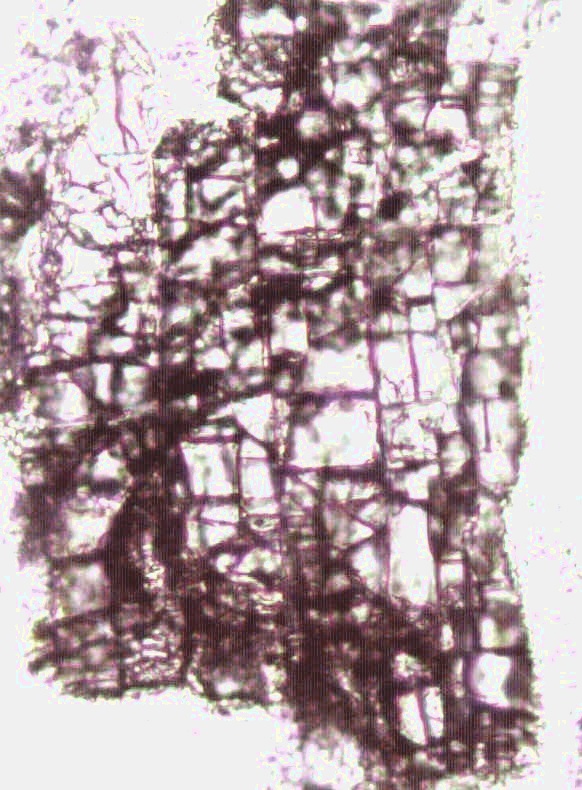
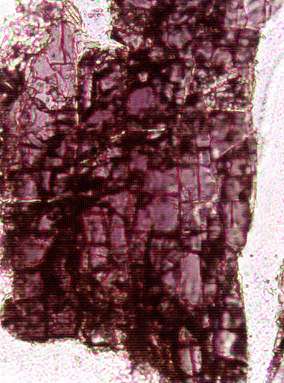
A thin section of tuhualite in plane polarized
light.
Left: E|| alpha. Right: E|| beta.
Polarized optical absorption spectra of a rare Fe2+, Fe3+-bearing silicate mineral, tuhualite, (Na,K)2Fe22+Fe23+Si12O30, were measured at room temperature in the range 350-4000 nm (ca. 28500 cm-1-2500 cm-1). The spectra display a number of strongly pleochroic absorption bands in the visible and NIR range, which are attributed to ferric and ferrous ions distributed over octahedral and tetrahedral sites in the structure. No absorption bands caused by H2O or OH stretching vibrations have been observed in the 3000 to 4000 cm-1 range. A narrow, weak absorption line at ~422 nm (g»b) is attributed to the 6A1g ®4A1g,4Eg spin-forbidden transition of six-coordinated Fe3+ ions that occupy the octahedral Fe(2) position of the tuhualite structure.
A broad, intense band at ~573 nm (g>b>>a) is assigned to a Fe2+/Fe3+ intervalence charge transfer transition (IVCT) between tetrahedral Fe2+ and octahedral Fe3+. Together with the high-energy absorption edge, the band at 573 nm causes the intense violet color and spectacular pleochroism (g>b>>a) of tuhualite. An intense band at ~1040 nm (g>b>>a) and a much weaker band ~ 2150 nm (a) are attributed to spin-allowed dd transitions of Fe2+ in strongly distorted tetrahedral Fe(1) sites.
On the basis of the data obtained for
tuhualite, optical spectra of the structurally related minerals
beryl, cordierite of ferrous iron in these minerals over
structural octahedral and tetrahedral and osumilite are discussed
and re-assigned. The spectra are re-interpreted on the basis of a
distribution of ferrous iron in these minerals over structural
octahedral and tetrahedral positions.
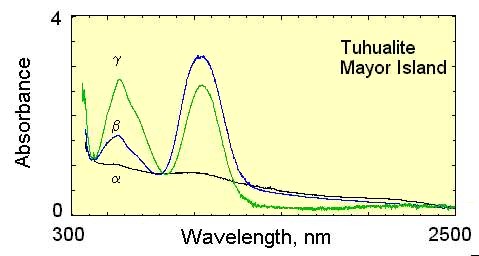 |
Optical absorption spectrum of tuhualite
Figures from the paper in TIFF format: Figure 1 Figure 2 Figure 3 Figure 4 Figure 5 Figure 6 Figure 7
Tuhualite optical absorption spectrum data files in x,y format: alpha polarization beta polarization gamma polarization