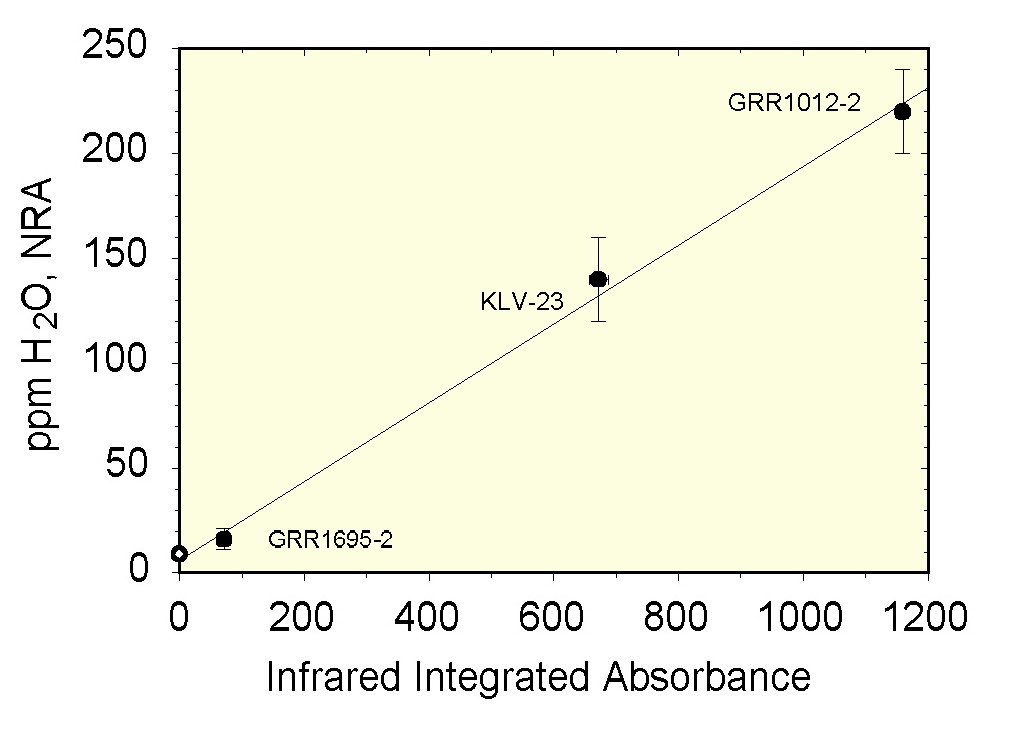
Figure 5. Correlation between the NRA analysis and the infrared integrated intensity.
Journal of Geochemical Research, 108(B2), 2105, doi:10.1029/2001JB000679, 2003.
Olivine is an important host of H in the Earth's
upper mantle and the OH abundance in this mineral determines many
important physical properties of the planet's interior. To date,
natural and experimentally hydrated olivines have been analyzed
by uncalibrated spectroscopic methods with large (± 100%)
uncertainties in accuracy. We determined the H contents of three
natural olivines by 15N nuclear reaction analysis
(NRA) and use the results to calibrate the common IR
spectroscopic method for quantitative H analysis of olivine. OH
content (expressed as ppm H2O by weight) is 0.188
times the total integrated absorbance of the fundamental OH
stretching bands in the region 3650 - 3100 cm-1. The
results indicate that an upward revision of some previous
determinations by factors of between 2 and 4 is necessary. The
most hydrous naturally occurring mantle derived olivine analyzed
to date contains 240 ppm wt. H2O, while the solubility
of H in olivine at its high pressure limit of stability is
approximately 6000 ppm wt. H2O. A posteriori
application of this calibration to experimentally hydrated
olivines may be limited due to the spectral differences from the
calibration samples and use of non-polarized spectra.
Figure 5. Correlation between the NRA analysis and the infrared
integrated intensity.
Illustration of the baseline problem
Comparison of NRA to the Paterson Method
GRR 1012
alpha = E parallel b
beta = E parallel c
gamma = E parallel a
GRR 1695
E parallel alpha
E parallel beta
E parallel gamma