David. R. Bell1, George R. Rossman
Division of
Geological and Planetary Sciences
California Institute of Technology
Pasadena, CA 91125-2500, USA
Joachim Maldener2, Denis Endisch3, Friedel Rauch
Institut für
Kernphysik
J.W. Goethe-Universität
August-Euler-Str 6, D-60486, Frankfurt (M), Germany
1Present address: Department of Chemistry and Biochemistry, Arizona State University, Tempe, AZ 85282
2Present address: Kennedystrasse 24a, 63477 Maintal, Germany
3Present address: Allied Signal Inc., 1349 Moffet Park Drive, Sunnyvale, CA 94089, USA

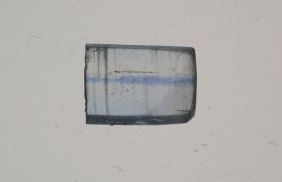
Kyanite H-105650, 17 mm wide
The hydrogen contents of four natural kyanites were determined by 15N nuclear reaction analysis and used to calibrate an IR spectroscopic method for a more convenient quantitative H analysis of kyanite. Hydrogen is present as the OH- ion and (expressed as ppm H2O by weight) ranges from near zero up to 230 ppm. Its content is best determined from integrated absorbance of the OH bands in the 3200-3500 cm-1 range. Approximate concentrations can be determined from measurements of either summed peak heights or integrated areas of spectra obtained from just the two principal optical directions in the cleavage plane. The present calibration leads to estimates of the OH concentration in kyanite that are about a factor of 18 lower than the earlier calibration of Beran and Götzinger (1987).
 |
 |
 |
|
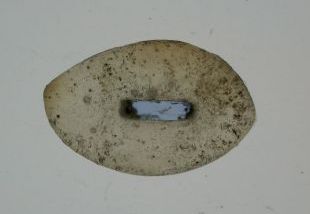
H-85493, 5 mm wide |
LTL-3 embedded in plastic, 3 mm wide |
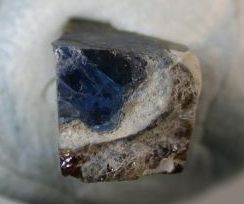
FSM-15 in matrix |
| St. Gothard, Switzerland* | Letlhakane Mine, Botswana | Frank Smith Mine, South Africa |
*Mislabeled in the original paper as Brazil.
| low resolution jpg | high resolution tif* | |
| Figure 1a | Download | Download |
| Figure 1b | Download | Download |
| Figure 1c | Download | Download |
| Figure 2 alpha | Download | Download |
| Figure 2 beta | Download | Download |
| Figure 2 gamma | Download | Download |
| Figure 3 | Download | Download |
| Figure 4 | Download | Download |
| Figure 5 | Download | Download |
| *Right click and 'save as' to your disk | ||