Division of Geological and Planetary Sciences
California Institute of Technology, M/C 170-25, Pasadena, CA
91125-2500, USA.
ABSTRACT
We performed new experiments on incorporation of hydrogen in
olivine at high pressures (2-12 GPa) and temperatures
(1000-1300°C). OH concentrations were calculated using the Bell et
al. (2003) calibration applied to principal-axis infrared absorption
spectra synthesized from polarized measurements on randomly oriented
grains. Starting materials for the experiments included both
fine-grained powders and larger single crystals. Hydrogen was
incorporated during grain growth in the former case and by volume
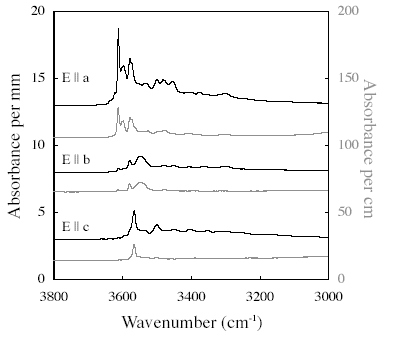
diffusion in the latter. The spectra of
Fe-bearing olivines exhibit
similar structure regardless of the
starting material, and are dominated by bands in the wavenumber
range from about 3500 to 3650 cm-1. We do not observe
bands near 3525 and 3573 cm-1, which are predominant
in many natural olivines as well as olivines annealed in experiments at
lower pressures and are attributed to humite-related defects.
Furthermore, bands between 3300 and 3400 cm-1, attributed to
high silica activity or high oxygen fugacity, are weak or non-existent.
Our measurements indicate that OH solubility in Fe-bearing olivine is
2.5-4 times higher than that measured by Kohlstedt et al. (1996).
Although this is largely due to the use of a new calibration in our
study, correction of previous values is not straightforward. In the
pure Mg-system, in contrast to Fe-bearing olivine, order-of- magnitude
apparent differences in OH solubility can be obtained using different
experimental procedures. This raises questions about attainment of
equilibrium in experimental studies of hydrogen incorporation in
nominally anhydrous minerals, particularly when crystals are grown from
a hydrous melt.
|
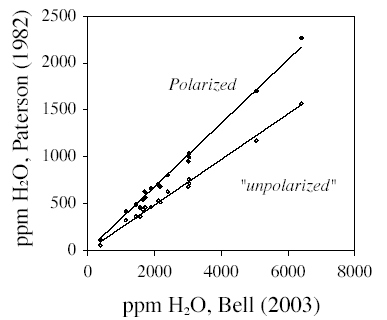
| Figure 8. Comparison among IR
calibrations applied to our experimental samples. Filled and unfilled
circles are for polarized and unpolarized IR spectra,
respectively. Spectra were calculated as discussed in the text.
Regression lines constrained
to pass through the origin indicate that the Bell et al. (2003)
calibration gives 2.95 or
4.12 times the amount of the Paterson (1982) calibration for polarized
and unpolarized
radiation, respectively. |