A
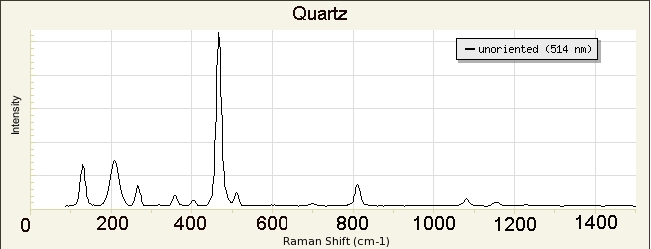
library of Raman spectra of minerals is available at
http://rruff.info/ and 8s incorporated in our instrument.
We will use the library in our instrument to identify our unknowns.
B.
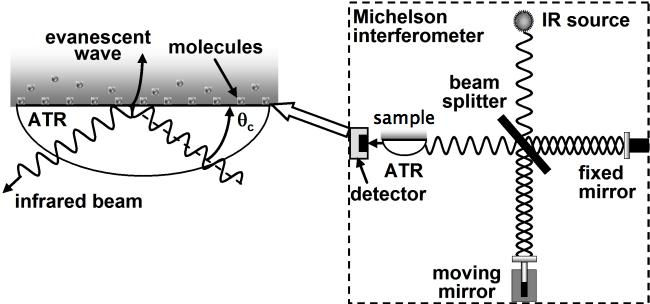
FTIR-- Specular Reflectance
Specular
reflectance involves reflecting light off a smooth surface (
a
specular reflection). This method is useful in that it is
non-destructive and allows us to analyze minerals that are difficult to
separate from their host rock. In our case, we will use a
polished slab of the rock that has individual crystals large enough to
fill the ~2 mm beam of the reflectance accessory.
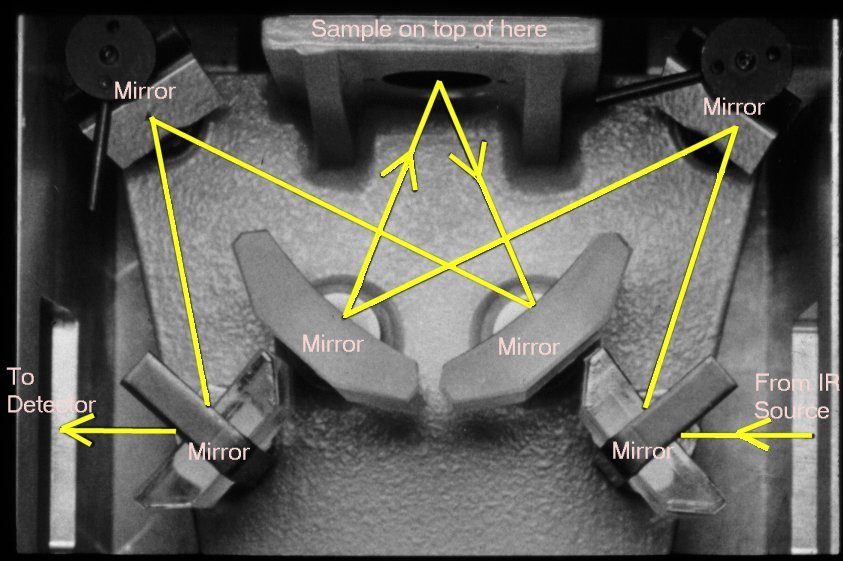
Spectroscopy using specular reflectance takes advantage of
the fact that the reflectivity of a sample increases at the wavelength
of IR absorption. We will need to swap out the DuraScope
assembly with the micro specular reflectance assembly (see below),
switch our program to use the
Specular Reflectance experimental setup, and identify
minerals using the the libraries specific to this type of spectroscopy.
Do these phases appear to be pure, or are there signs of alteration or
mixtures in the spectra?
C. FTIR-- Microscopic
Transmission
You will use infrared
spectroscopy to analyze the amount of water in your feldspars. Electron
microprobe and SEM-EDS analyses were unable to detect the very light
elements. Hydrogen is an element that infrared can easily detect in the
form of water molecules and OH groups.
We will instruct you
how to do micro-infrared spectroscopy first on a garnet, then on a slice of the Ge 116 rock,
and you will obtain the infrared spectrum in two (of the three
possible) polarization directions. The general
routine will be to focus the microscope on a transparent sample, then
focus the IR measurement area aperture on the same location, then
obtain a transmission IR spectrum under the
Microscope experimental
setup. The detector we use for this section is a
Mercury-Cadmium-Telluride alloy (MCT), good for measuring absorptions
in the mid-IR range, which includes X-OH vibrations.
To detemine the water content of the garnets, use:
Quantitative analysis of trace OH in garnet and pyroxenes
by Bell DR, Ihinger PD, Rossman GR
To interpret your feldspar
results, use the following article to determine the water concentration
in the white feldspars in your rock.
Is the water that you
see due to fluid inclusions, clays (or other alteration products) or
structurally-bound water in the feldspar structure?
Ideally you would
have three spectra taken in three orthogonal polarization directions to
use for the determination of the total water content in the feldspar.
In our case we have only have two. So, after looking at the reference
above, make an educated guess about the intensity in the third
direction.
Sum the integrated
intensities for the three polarization directions and determine the
water content of this feldspar.
Is the water content
you measured in the range previously found for feldspars or is the
result suspect?D.
Optical spectra
determination of iron site-occupancy (if time allows)
We will learn to use the
optical spectrometer by transmitting light through a pyroxene crystal
on a thin section. We will locate the two extinction directions and
obtain polarized spectra in those directions. You will obtain spectra
under two different conditions. One with a visible light detector
(silicon diode array) and the other with a near-infrared detector
(indium gallium arsenide diode array). Merge the two spectra together
in Excel or another graphics program. Be sure to pay attention to the
absolute intensity and which polarization directions the spectra
correspond to.
Use the following
references (or others you find) to identify the dominant oxidation
state of iron that contributes to the optical spectrum:
Note from
the TA on what we're looking for in the writeup for these two weeks:
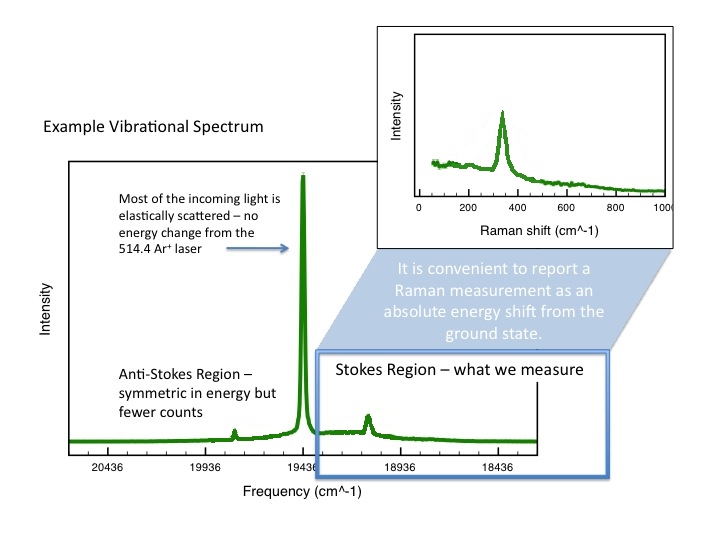
RAMAN.
Give me a few examples
of obtained spectra/identifications. Combining the results
from your SEM, microprobe, and now Raman analyses, what is the updated
mineral list for your thin section? Present your results in a
way that shows which minerals were identified by which method, the
chemistry, and the estimated volumetric proportions. If the Raman
spectrum either totally fails to identify the unknown phase, or if it
is unable to narrow a list of possible minerals, discuss why these
problems occur.
IR/VIS.
A. Give me a
few examples of obtained unknowns and identifications using ATR and
specular reflectance.
B. Give me
representative polarized spectra, and tell me: Is there water? What
kind, and how do you know? How much (with what assumptions)? Are your
values similar to those previously reported?
C. Give me
the stitched spectra for both polarizations. What is the oxidation
sstate of Fe, and which cation site is it dominantly located in?
Finally, or dispersed
through your report, give me a quick, one sentence summary of each of
these methods, including what kind of measurement or sample it is best
for. In other words, why would you use this method over your
other available tools?
Last updated: 4-Jan-2022