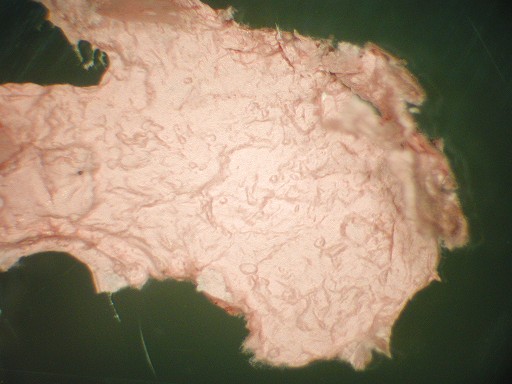
Mat of fibers extracted from rose quartz from Madgascar.
Also see part one of this series of papers on rose quartz.
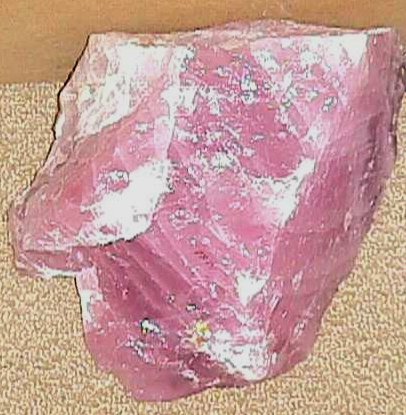
Pink fibrous crystals within massive rose quartz from localities in California, South Dakota, Brazil, Madagascar and Namibia were examined with high-resolution transmission electron microscopy (HRTEM) and analytical electron microscopy (AEM). This study reveals that the nanofibers in all samples are related to dumortierite. Selected-area electron diffraction (SAED) patterns and HRTEM images indicate that the dumortierite-related fibers have a superstructure with a doubled repetition period along the x- and y- axes of dumortierite, giving cell parameters a = 2adum = 2.36 nm, b = 2bdum = 4.05 nm, c = cdum = 0.47 nm. Computer simulations suggest that periodic arrangements of two different M(1) site occupations in the octahedral face-sharing chains give rise to the superstructure. One type of M(1) site is occupied mainly by Al, whereas the other type is dominated by Ti and Fe. Simulated structural images based on our proposed model match the experimental structural images. Most of the fibers, elongated along the z axis, are free of defects. AEM analysis shows that the dumortierite-related fibers have a composition similar to well-characterized dumortierite, but that they contain a greater amount of Fe substituting for Al in the M(1) sites. B was detected in all fibers examined by electron energy loss spectroscopy as well as in sillimanite crystals found as a minor component in one rose quartz from Brazil.
Mat of fibers extracted from rose quartz from Madgascar.
Figures from the paper
Figure 1, 400 KB. Low-magnification bright field image showing dispersed fibers on a carbon film. The fibers are from a rose quartz from Madagascar (GRR1815). Smaller version - 62 KB. Larger version - 1.6 MB.
Figure 2. 380 KB. Simulated HRTEM images of dumortierite with different orientations and at different thickness and defocus conditions using optical constants for the Philips EM430. (a) [100] zone, (b) [110] zone. Smaller Version - 190 KB jpg image. Larger version - 7.6 MB jpg image
Figure 3. 380 KB. (a) Representative zone axis SAED patterns of single fibers obtained from different orientations: [100], [010], [110], [111] and [001]. (b) Zone axis SAED patterns of the dumortierite standard from [100], [110], [111] and [001]. All indices are based on the dumortierite structure determined by Moore and Araki (1978). Larger version - 2.5 MB. Largest version - 10.3 MB.
Figure 4. The [010] zone CBED pattern of a fiber from GRR1819 showing the First-Order Laue Zone (FOLZ) and the Second-Order Laue Zone (SOLZ).
Figure 5. HRTEM images of single fibers showing 2.04 nm real-periodicity along the [110]* direction and 1.02 nm subperiodicity at a thinner area. (a) [110] zone, (b) [112] zone.
Figure 6. HRTEM images of single fibers down the [100] zone axis showing only subperiodicity along the [010] direction, such that d(020)super = bdum.
Figure 7, [001] zone axis HRTEM images of a fiber from GRR1815 showing its cross section.
Figure 8, Octahedral cation contents in the fibers from rose quartz (this study), classic dumortierite (Alexander et al. 1986) and magnesiodumortierite (Chopin et al. 1995). Larger version of same graph
Figure 9. PEELS spectrum of (a) a dumortierite-related fiber (GRR1819), (b) the dumortierite standard (GRR347), and (c) a sillimanite nanocrystal (GRR1864). The boron K edge is evident in all spectra. This is a 250 KB MS Word document.
Figure 10. Comparison of infrared absorption spectrum taken through a mat of pink fibers (GRR 1815) and a polycrystalline slab of pink dumortierite (GRR122).
Figure 11. (a) A thin sillimanite crystal from GRR1864. (b) [110] zone axis HRTEM image of the sillimanite crystal from GRR1864 and its SAED pattern.
Figure 12. The superstructure model (a = 2adum, b = 2bdum, c = cdum). The superstructure is strongly pseudohexagonal, with c the pseudohexad axis. There are two types of M(1) chain: Type I filled with Al and Type II occupied by Ti and Fe.
Figure 13, HRTEM images
of single fibers viewed down the (a) [112] and (b) [110]
directions, matched with the inserted simulated images using the
superstructure model.
See also part one of this series of papers on rose quartz.: